
SkewTLogPro
Professional Weather Data, Simplified
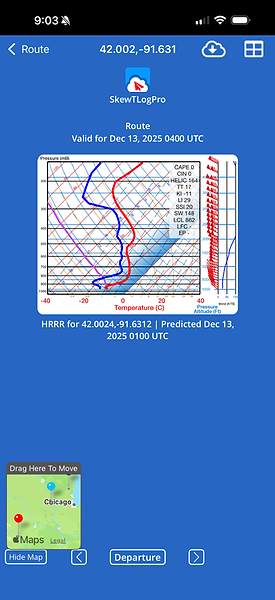
Skew-T diagrams have long been the gold standard for understanding atmospheric stability. SkewTLogPro brings this powerful tool to your fingertips with an intuitive interface designed for mobile use.
-
HRRR model: 3km resolution, hourly out to 18 hours
-
GFS model: Global coverage, 5-day forecasts
-
Real-time stability indices (CAPE, CIN, LI, LCL)
-
Wind profile and barbs visualization
-
Route mapping with live radar overlay
-
AIRMETs & SIGMETs along your route (IFR, ICE, TURB, LLWS)
-
Tap any point for altitude-specific Skew-T data
Features include the ability to select to graph information from your current location, an airport ID, or from a latitude and longitude entered.
Detailed information at specific milibars of pressure and altitudes are available for viewing. Slide your finger on the graph to see individual values

Map
View hazards quickly though altitudes along your flight path quickly and easily.
View all alerts and their description instantly